


Stop Building Reports by Hand
March 29, 2026 | API, BI Reports, Reports
10 mins min
Learn how higher education IT teams use LabStats for automated reporting on hardware, software, and lab capacity across the IT environment.
How Higher Education IT Teams Switched to Automated Reporting with LabStats
Every semester, IT teams at colleges and universities face the same grind: someone needs a report. Maybe it’s the provost asking how many computers are actually being used in the engineering lab. Maybe it’s procurement wanting to know which software licenses can be dropped at renewal. Maybe it’s a department head who wants to understand peak usage hours so they can justify extending lab staffing.
And every time, someone on your team cobbles together data from multiple systems: login logs, imaging tools, endpoint management platforms, spreadsheets, formats it nicely in Excel, and hands over something that’s already out of date by the time anyone reads it.
This is the reporting problem that LabStats was built to solve. Not just to collect data on lab computer and software usage, but to make that data continuously available, automatically formatted, and actionable without requiring a manual effort every time someone has a question.
The real cost of manual reporting
Labor is probably one of the most obvious cost saving. A report that takes two hours to build every month is 24 hours a year, and that’s if it’s only requested monthly. In reality, these requests come in more often, with variations, and they always seem to arrive at the worst possible time.
But the less visible cost is the quality gap. When reports are built manually, they reflect a snapshot in time. By the time data has been pulled, cleaned, formatted, and distributed, it is already historical. For decisions like whether to keep a lab open late during finals, or whether to renew a software license that may or may not still be in use, stale data doesn’t lead to the best decisions or can lead to decision paralysis.
Disparate data points, reported for specific purposes, are not connected across the institution to paint a bigger picture, such how technology access can impact student outcomes, or which students are at risk of disengagement. It keeps IT in a reactive position, responding to single demands for reports, instead of taking a more strategic role of providing connected intelligence across the institution. And this leads to missed opportunities for saving, right-sizing and strategic engagement.
There is also the fragility problem. Reports that live in individual spreadsheets, built by one person who knows which systems to query and how to format the output, create institutional risk. When that person is out, or moves on, the reporting process breaks.
What LabStats collects and why it matters
LabStats is a usage monitoring platform designed specifically for managed computing environments in higher education. Once deployed, clients installed on lab computers, classroom workstations, and other managed devices continuously track:
- Which computers are in use, idle, or offline – in real time
- Which software applications are being launched, for how long (including focus use), by how many users, and which users.
- Historical usage patterns across days, weeks, semesters, and years
- Station-level details including location, hardware specifications, and group assignments
This data is centralized in the LabStats platform, analyzed and updated continuously. The result is a single source of truth for hardware and software usage across an institution, without requiring IT to query multiple systems or reconcile conflicting records.
For institutions that don’t yet have this kind of centralized visibility, the alternative is typically a combination of endpoint management tools, manual log reviews, and periodic walkthroughs. None of these approaches produce the granularity, continuity, or speed that operational decisions actually require.

Three ways LabStats delivers reports without manual effort
1. Built-in web portal reports
LabStats includes a library of pre-built reports accessible directly from its web portal. These reports are designed around the questions IT professionals in higher education ask most often:
- Which machines have had zero use this semester?
- Which software applications have had zero launches?
- Which labs are consistently at capacity, and which are consistently empty?
- How does usage compare across locations, time periods, or student populations?
These reports require no configuration, no query writing, and no data export. They are generated from live data and can be run on demand by anyone with appropriate access. Stakeholders – department chairs, budget administrators, lab managers – can be given access to pull their own reports rather than submitting requests to IT.
The portal also supports scheduled report delivery, meaning recurring reports can be configured once and automatically emailed to recipients on a regular cadence. A monthly software utilization summary, a weekly hardware availability report, a semester-end usage breakdown – all of these can be set up and forgotten.
2. Power BI report templates and direct data access
For institutions that want to go beyond the built-in reports – combining LabStats data with financial data, enrollment data, or other institutional records – LabStats provides a Direct Data Access layer that integrates with business intelligence tools like Microsoft Power BI.
This capability allows IT teams and institutional analysts to build custom dashboards that reflect their specific context. A Power BI dashboard can pull hardware utilization rates from LabStats and display them alongside room reservation data from a facilities system, giving academic planners a complete picture of space efficiency. A software licensing dashboard can show utilization against license counts, making renewal conversations with vendors concrete and defensible.
LabStats provides ready-to-use Power BI templates for both hardware and software analysis, which are included for customers and can be downloaded and connected to live data without starting from scratch. These templates are a practical entry point for institutions that want advanced analytics without the build time.
3. The LabStats API
For teams that want to automate reporting as part of a broader institutional data pipeline, the LabStats API provides programmatic access to the full range of usage data. This means LabStats data can be pulled into any system – a data warehouse, a custom dashboard, an ITSM platform, a homegrown reporting tool – on whatever schedule the institution requires.
The API supports both real-time and historical endpoints, allowing teams to query current station status (which computers are in use right now?) as well as long-range historical trends (how has usage changed over the past three years?). Responses are paginated for large datasets and cached to maintain performance at scale.
API keys are created and managed within the LabStats admin portal. Two methods are available: the API Management method for applications that don’t need historical data, and the BI Reports method for applications that require access to the three history endpoints. Once a key is created with the appropriate permissions, it can be used by any application or script capable of making HTTP requests.
The organizational rate limit is 250 API requests per minute, which is sufficient for the vast majority of institutional reporting workflows. For teams building automated pipelines, the API documentation includes a sandbox environment where queries can be tested against live data before being deployed to production.
Specific use cases worth automating
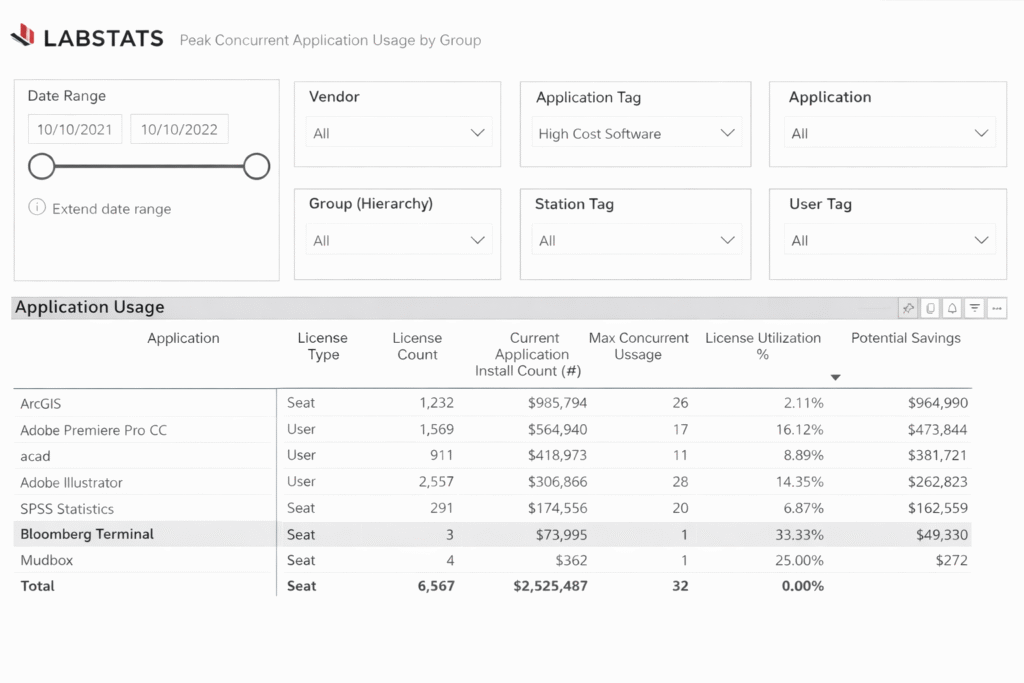
1. Identifying underutilized software licenses
Software licensing is one of the highest-leverage areas for LabStats reporting. Campus-wide software agreements are expensive, and many institutions are paying for seat counts that reflect historical assumptions rather than actual use.
LabStats tracks every application launch across every managed computer. This makes it possible to generate a report showing which licensed applications have had zero launches in the past 90 days, which applications are launched only occasionally and might be candidates for shared licensing, and which applications are consistently at or near their seat limit and may need additional licenses at renewal.
Running this report manually – pulling launch logs from individual machines or from an endpoint management tool – is time-consuming and error-prone. In LabStats, it is a built-in report that can be scheduled to run and be delivered to the appropriate stakeholder before every major renewal cycle or at a timing of choice.
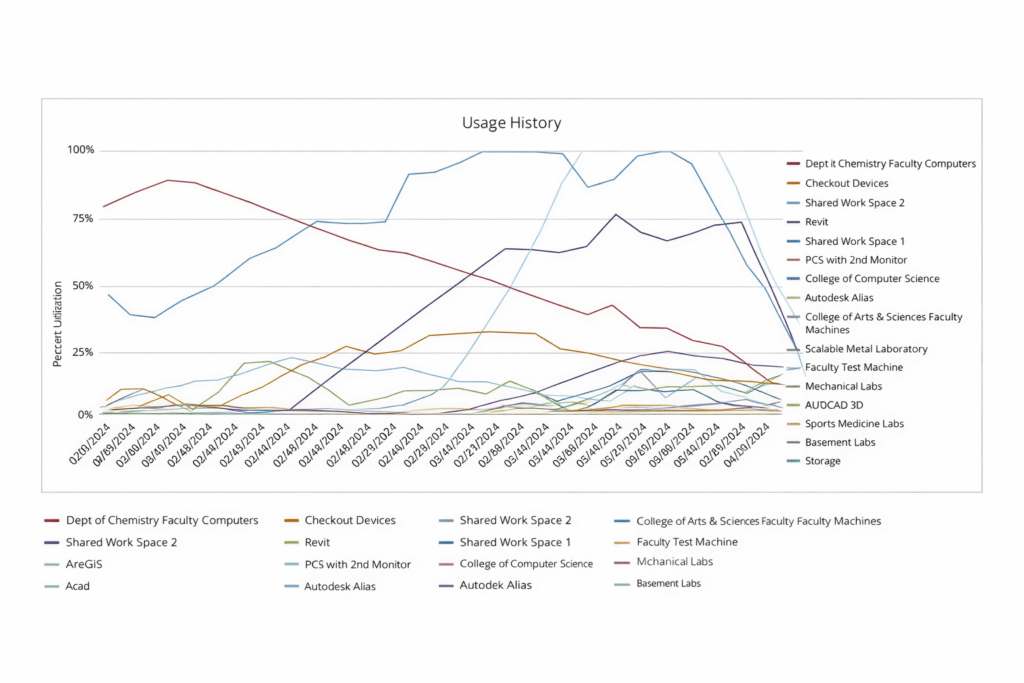
2. Demand-based lab staffing and hours
Lab staffing decisions are typically made based on institutional tradition or gut feel rather than data. A lab that has been open until 10 PM for a decade may genuinely need those hours, or it may be serving three students per night while the institution pays for full staffing coverage.
LabStats provides usage data at the granularity needed to answer this question precisely. Reports showing station utilization by hour of day and day of week make it straightforward to identify periods of genuinely low demand. This data can support decisions to adjust lab hours or staffing coverage in ways that are both operationally efficient and defensible to administrators.
When these reports are automated, lab managers get this data on a regular schedule rather than only when someone thinks to ask for it. That proactivity changes how decisions get made.
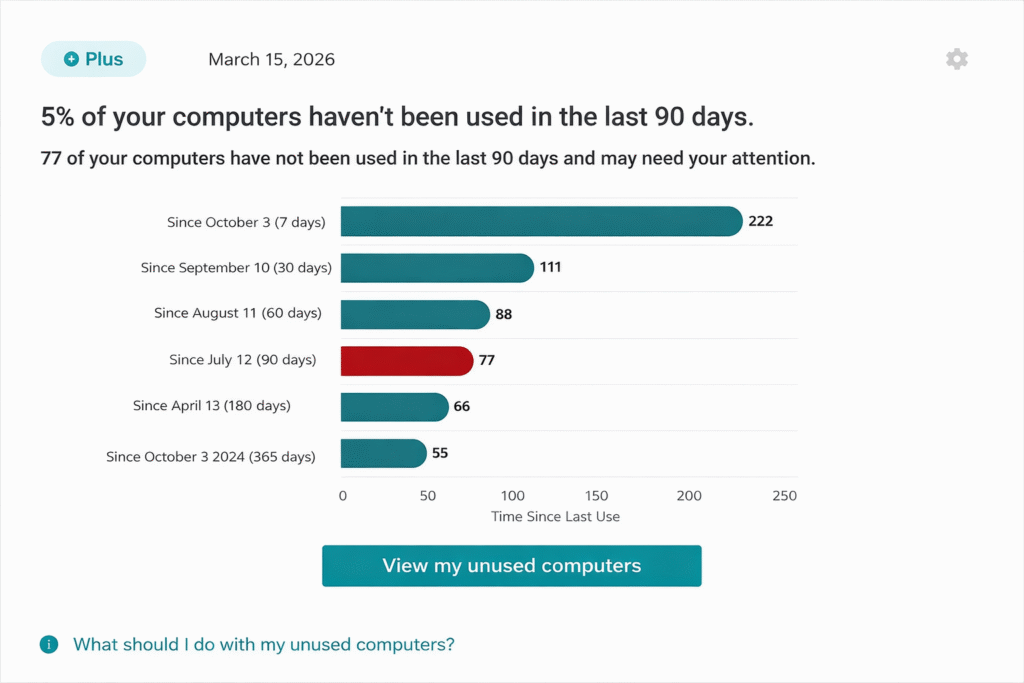
3. Finding machines that aren’t being used
Hardware refresh cycles are expensive decisions. Before purchasing new equipment, institutions need to know whether existing equipment is being used, and before decommissioning anything, they need to understand whether absence of use reflects obsolescence or simply a mismatch between machine location and student traffic.
LabStats can identify computers with zero or near-zero usage over a configurable time window. This is particularly useful for understanding whether distributed computing resources – machines in department offices, specialty labs, or satellite locations – are worth maintaining. A machine that hasn’t been logged into in six months may be a candidate for redeployment to a higher-traffic location rather than a refresh.
For teams not yet using LabStats
The use cases described above require LabStats to be deployed and collecting data. Deploying LabStats involves installing lightweight agents on managed computers, which can be done through standard software deployment tools: SCCM, Jamf, GPO, or other endpoint management systems. LabStats supports Windows, Mac, and ChromeOS environments, as well as virtual desktop infrastructure.
Once agents are installed and reporting in, the web portal provides immediate visibility into station status and usage. Historical data accumulates from the point of deployment forward, which means the earlier an institution starts, the richer the historical dataset available for trend analysis.
For institutions running on-premises infrastructure, LabStats supports an on-premises deployment model that keeps data within the institution’s own environment.
The compounding value of automated reporting
There is a pattern that plays out consistently when institutions move from manual to automated reporting: the first benefit is time savings, but the lasting benefit is better decisions, made more often.
When a report requires significant manual effort, it gets run infrequently, typically in response to a specific question or a budget cycle. When the same report is automated and delivered on a schedule, decision-makers start to act on it proactively. Lab hours get adjusted mid-semester rather than annually. Software license discussions with vendors are informed by current data rather than prior-year assumptions. Hardware refresh priorities shift from the loudest department to the highest-need location.
This is the difference between reporting as a reactive service and reporting as an institutional capability. Responding to the strategic needs of most institutions in the current climate, to create efficiencies, save costs, with out compromising the student experience by moving data to insights, and insights to action.
Getting Started
If you are already a LabStats customer, but not making full use of automated reporting features, you can access them through the web portal under BI Reports, request API credentials under Admin > External Systems > API Management. Or schedule a tutorial through the support site to set up Power BI integrations.
If you’re considering LabStats – request a walkthrough at labstats.com/walkthrough or start a free trial at labstats.com/free-trial.
Support and documentation for all reporting features is available at support.labstats.com, including step-by-step how-to guides, API documentation with a live sandbox, and the LabStats Academy for on-demand training.
For direct assistance, contact the LabStats support team at [email protected] or by phone at +1 (208) 473-2222.
Work With Us
LabStats specializes in helping IT leaders reduce spend and get their budgets right.