Direct Data Access
Direct Access to Live and Historical Data
- Access LabStats data with our RESTful API using your preferred BI tool
- Customize your security settings to keep your data safe
- Reduce development time, and enhance brainstorming, using the straightforward testing capabilities
- Access all your data in one visualization
- Try it out at api.labstats.com

Use Your Preferred BI Analytic Tools
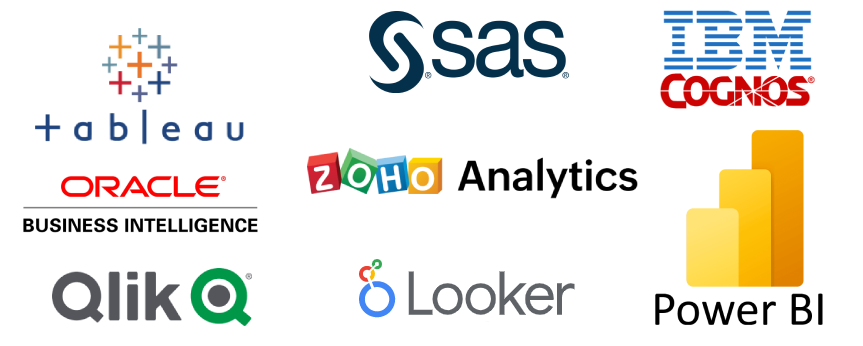
LabStats data can be used with your preferred BI analytic tools including:

Combine LabStats Data with Other Data Sources
LabStats data can be combined with many data types from different sources to address broader and higher-level goals and concerns. Examples include:
- Demographic Data – Combine with Student Management Systems to find out how students from specific majors or demographic groups use technology and/or software, and uncover relationships to student success.
- Financial Data – Understand how much each use of specific software applications costs your organization
- Inventory – Compare inventory levels to actual uses to gain insights surrounding software negotiations, finding unused computers, and optimizing tech facilities
- Security – Look for user patterns at precise times, in specific locations, to identify security vulnerabilities and risks
- Utilities – Understand power consumption trends through comparisons of technology location and use data to known power consumption information


Share Insights With Key Stakeholders and Decision Makers
With your organization-wide data consolidated with LabStats data, you’re ready to share
fact-laden insights with key stakeholders and decision makers:
- Create and customize dashboards specific to your, and your audience’s, needs
- Build presentations in the formats decision makers want and need it
- Enhance storytelling with discoveries backed by real and accurate data
- Communicate from a position of strength and in a way that fits your organization’s needs

Save Time with Automated Reports and Alerts
Using your BI tool, set up automated reports and alerts to provide scheduled updates and real-time notices of important changes, events, and use cases. Examples include:
- Zero Use Software / Hardware: A regular report identifying hardware and software that isn’t being used during a specific timeframes, supporting accurate reallocation and decommission decisions
- Out-of-Bounds Report: A report showing when a particular technology asset is being used over a preset percentage limit, indicating more resources need to be assigned to that area
- Scheduled Online Alert: An alert notifying you that computers scheduled to come online at predetermined times have not, helping you address availability issues before users find them
- Unauthorized Use Cases: Alerts making you aware that unauthorized use cases are being attempted, so you can address potential or eminent issues

Get a Quick Start – Power BI Dashboard Templates
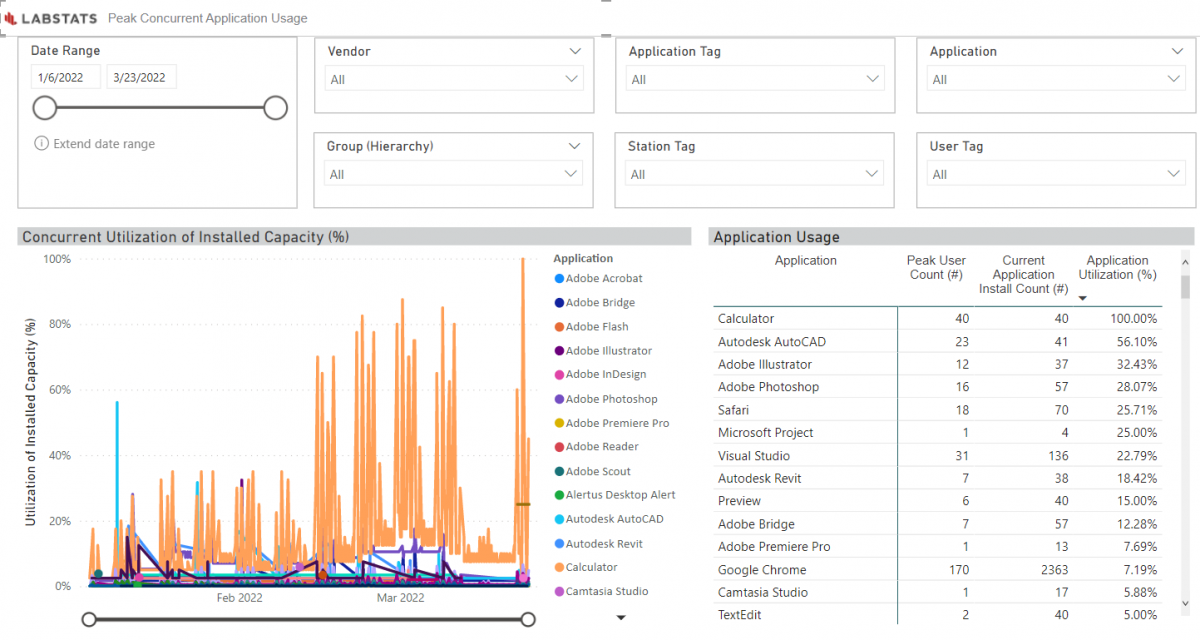
We offer pre-built Hardware and Software Dashboard Templates in Power BI to give non-BI tool experts a quick start to analyzing large data sets accessed directly at api.labstats.com.
Our Dashboard Templates:
- Are free to LabStats subscribers
- Answer important and common technology use and location questions
- Can be published1 to other stakeholders
- Can be saved as reports and exported as PDFs2 if sending a results snapshot is the preferred sharing method
1 Publishing live reports requires Power BI subscriptions, check with your organization to determine your licensing model. Additionally, if your organization has Power BI Premium Subscription(s), the added benefit of publishing / linking reports directly to a PowerPoint presentation is available.
2 A Power BI subscription is not required to export PDFs.


